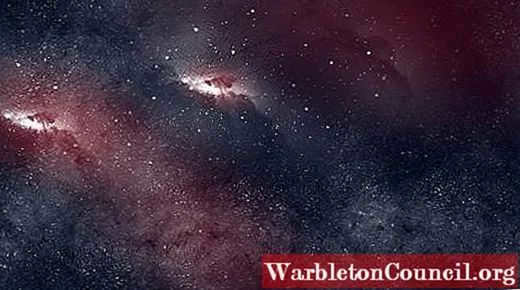
The color of stars is determined by their temperature and mass. This process starts when a star is born, which happens when a nebula condenses and undergoes nuclear fusion.
The color continues to change until the star has exhausted all of its fuel or energy, which is made up of a combination of hydrogen and helium. The birth of a star can take thousands or even millions of years.
Stars exhibit a variety of colors, which aids in estimating their approximate age. Take, for instance, the Sun, which possesses a yellowish hue; based on this, we can infer that it has an average lifespan.
The Sun is estimated to be between 4,000 and 4.6 billion years old, with a temperature near 6,000°C.
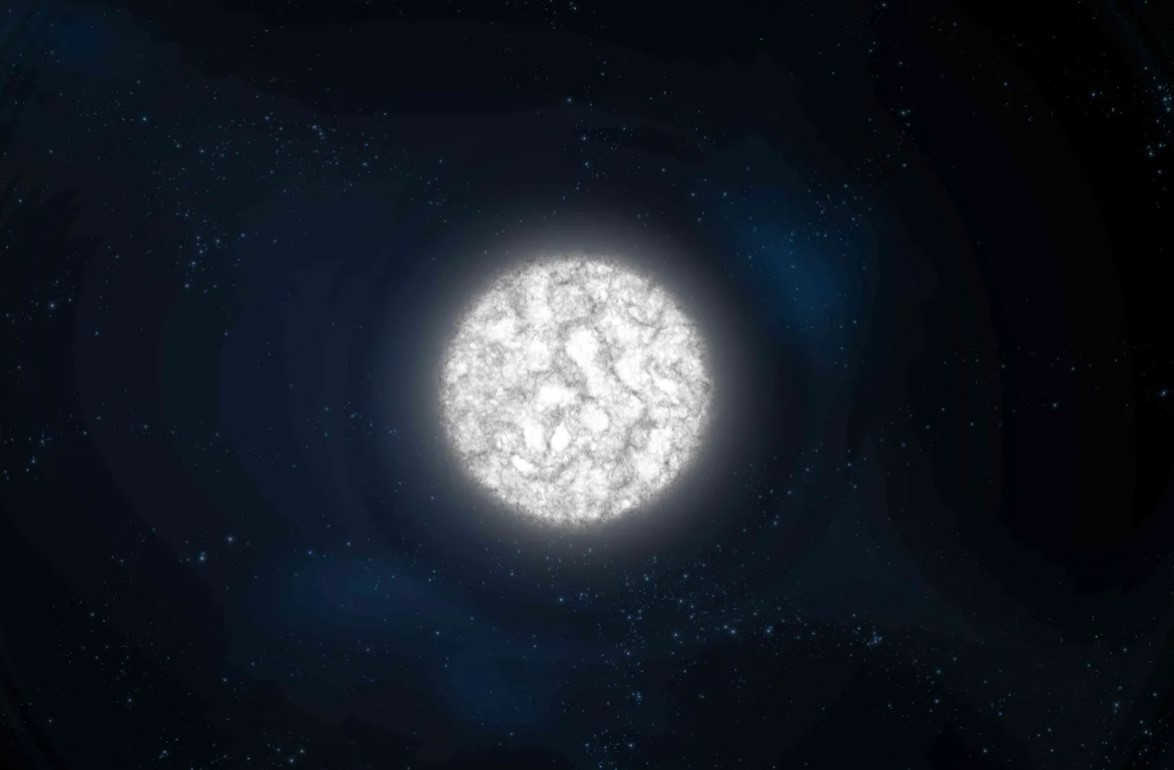
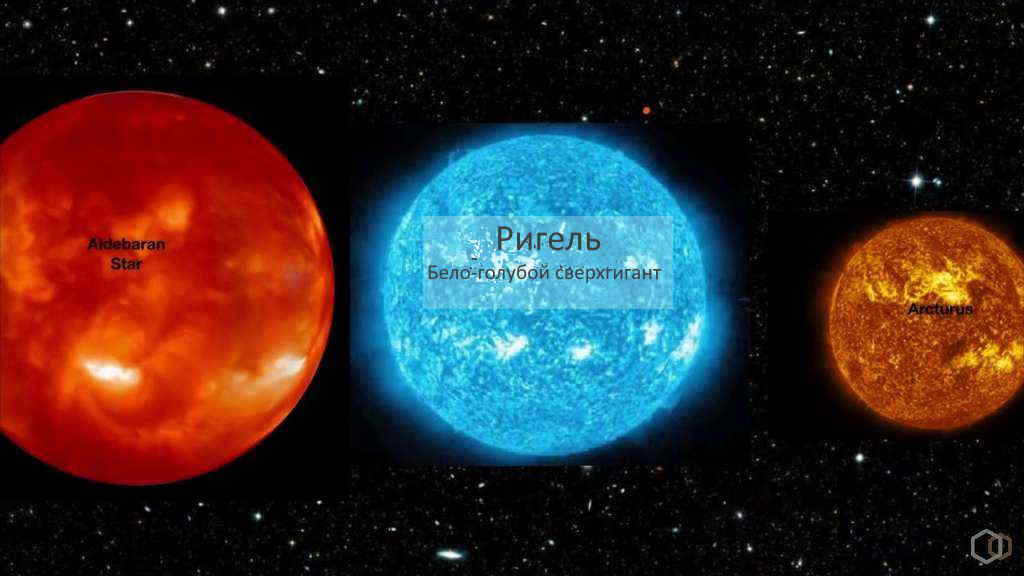
The youngest stars tend to be the hottest, with temperatures reaching up to 40,000 °C. On the other hand, the oldest stars have lower temperatures, typically around 3,000 °C, and display a reddish tint.
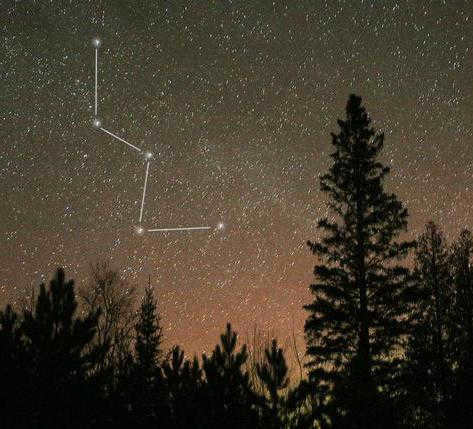
Categories of stars based on their color
1- Blue stars
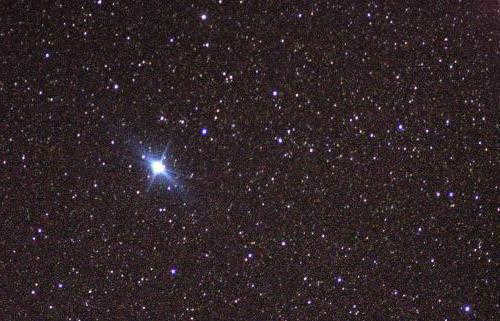
These celestial bodies belong to the group of the youngest stars. Their color is determined by their temperature, which happens to be one of the highest among all stars.
An excellent example of this category is the star Alnilam, which boasts a scorching temperature of 27,000 ° C and shines with a brightness equivalent to 375,000 suns.
Alnilam is particularly famous for being part of Orion’s belt, together with two other stars called Alnitak and Mintaka.
2- White stars.
White stars are characterized by their high temperature and their ultraviolet color. Despite this, they appear white to the human eye, as they emit light across the entire color spectrum, including UV rays.
One example of a white star is Spica, also known as Spike. It is located in the Virgo constellation and has a temperature ranging from 22,400 ° C to 18,500 ° C. Spica is larger than the Sun and is a prominent member of the white star classification.
Yellow stars, such as the Sun, have a temperature of approximately 6,000 ° C. They typically have an age ranging from 4 to 10 billion years.
After reaching about 12 billion years of age, a yellow star like the Sun begins the process of transforming into an orange or red star.
One of the most well-known yellow stars is our very own Sun. Another notable yellow star is Helvetzios, which belongs to the constellation Pegasus. It has a temperature of 5517 ° C and shares similarities with the Sun.
4-Orange stars
Orange stars have temperatures ranging around 4000 ° C. While some orange dwarfs may have temperatures below this threshold, they are still classified as orange stars due to their color and brightness.
For instance, let’s take a look at Arthur’s star, which exhibits an orange hue. Not only is it the brightest star in the sky, but it is also the second brightest star known to us.
With a temperature of 4290 ° C, this remarkable star can be found in the constellation El Boyero.
5- Red stars.
This is the final hue exhibited by stars. This is due to the depletion of their energy reserves.
In comparison to other stars, these stars have a significantly lower temperature, measuring approximately 3000 ° C.
One example of a red star is Betelgeuse, which is a constituent of the Orion constellation. It has a temperature range of 3,500 to 3,000 °C and is the most luminous star within its constellation.
References
- S., L. I. (2004). General geography for middle school. Mexico: Limus ed.
- Inglis, M. (2004). Astronomy of the Milky Way: An observer’s guide to the Northern Milky Way. New York: Springer Science & Business Media.
- Inglis, M. (2004). Astronomy of the Milky Way: A guide to observing the Northern Milky Way. New York: Publisher Unknown.
- Jones, L. W. (2009). A guide to the universe: Stars and Galaxies. Santa Barbara CA: ABC-CLIO.
- Milton D. Heifetz, W. T. (2008). A walk through the stars. Expanded fifth edition: A guide to the stars, constellations, and their legends. ACAL Editions.
- Rosie Coleman, A. S. (2007). Universio. ACAL Editions.
The classification of stars is determined by various factors, such as surface temperature, size, and brightness. Stars can be categorized into different colors, including yellow, blue, and red, based on their temperature. The hottest stars are blue or even bluish, while the coolest stars appear red. Yellow stars, such as the Sun, are located in the middle range of the temperature scale.
Variations
When bodies are heated to different temperatures, they emit light with varying wavelengths. The color that the human eye perceives is determined by this factor. The hotter the body, the shorter the wavelength of the light it emits, and the closer its color appears to white and blue. This principle also applies to stars.
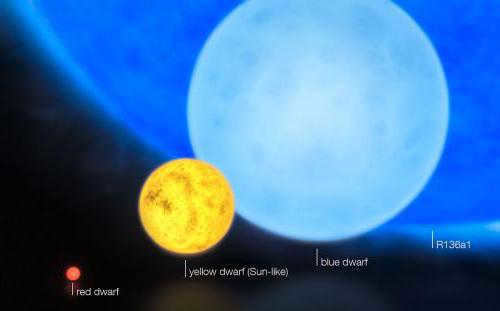
Stars that appear red are the coolest, with surface temperatures only reaching up to 3,000 degrees Celsius. A yellow star, like our sun, is hotter, with its photosphere heating up to 6,000 degrees Celsius. White stars are even hotter, ranging from 10,000 to 20,000 degrees Celsius. Finally, blue stars are the hottest, with surface temperatures reaching between 30,000 and 100,000 degrees Celsius.
Distinctive features
Scientists have discovered a plethora of yellow stars, many of which are widely recognized even by those who are not well-versed in astronomy. These stars vary in size, mass, luminosity, and other notable characteristics. However, what they all have in common is their surface temperature.
The yellow hue of these stars can be acquired over time through the process of evolution. Nonetheless, the majority of these stars can be found on the Main Sequence of the Hertzsprung-Russell diagram. These stars are commonly referred to as yellow dwarfs, and our very own Sun belongs to this category.

Dwarfs are the names given to these notable celestial bodies due to their comparatively small stature. The Sun, for instance, has an average diameter of 1.39*10 9 m and a mass of 1.99*10 30 kg. While these figures may seem immense in comparison to Earth, they are quite typical in the vastness of space. There are other yellow stars, as exemplified below, that surpass the Sun in terms of size.
Our luminary boasts a surface temperature of 6,000 Kelvin and belongs to the G2V spectral class. In actuality, it emits almost pure white light, but due to the unique composition of the planet’s atmosphere, the shorter wavelengths of the spectrum are absorbed. This absorption creates a distinct yellow tint.
Characteristics of the yellow dwarf
Characterized by its small size, yellow dwarfs have an impressive lifespan. On average, they can live up to 10 billion years. Currently, the Sun is positioned in the middle of its life cycle, with approximately 5 billion years left before it descends from the Main Sequence and transforms into a red giant.
Yellow dwarfs, like the Sun, are classified as “dwarf” stars and have similar dimensions. They derive their energy from the synthesis of helium from hydrogen. Once the hydrogen in the core is depleted and helium fusion begins, the yellow dwarf moves on to the next stage of evolution.
In addition to the Sun, other examples of yellow dwarfs include Alpha Centauri A, Alpha of the Northern Crown, Mu Volopas, Tau Kita, and various other stars.
Yellow subgiants
When sun-like stars deplete their hydrogen fuel, they undergo a transformation. The ignition of helium in the core causes the star to expand and evolve into a red giant. However, this transition does not occur instantaneously. Initially, the outer layers of the star start to burn, indicating that it has descended from the Main Sequence but has not yet reached the expanded state. At this stage, the star is classified as a subgiant. Typically, the mass of a subgiant ranges from 1 to 5 times that of the Sun.
Yellow subgiants can undergo a stage where they become even more massive in size. However, this phase is not as prominent for them. One well-known yellow subgiant in the present time is Procyon (Alpha Minor Dog).
A true rarity
The yellow stars listed above are relatively common types found in the Universe. However, hypergiants are a different story. They are the true giants, known for being the heaviest, brightest, and largest stars, but also having the shortest lifespans. While most hypergiants are classified as bright blue variables, there are also white, yellow, and even red hypergiants in existence.
One example of such rare cosmic bodies is Rho Cassiopeia. Rho Cassiopeia is a yellow hypergiant with a luminosity 550 thousand times greater than that of the Sun. It is located 12,000 light years away from Earth. On a clear night, it can be observed with the naked eye, with an apparent luminosity of 4.52m.
Supergiants
Hypergiants are a special type of supergiants, which also include yellow stars. According to astronomers, they represent a transitional stage in the evolution of stars from blue to red supergiants. However, yellow supergiants can remain in this stage for a considerable amount of time. Typically, stars in this stage of evolution do not undergo supernova explosions. Only two supernovae generated by yellow supergiants have been observed in the study of outer space.
Notable celestial bodies in this group include Canopus (Alpha Kiel), Rastaban (Beta Dragon), Beta Aquarius, and various other entities.
Each star, resembling the Sun in its yellow color, possesses distinct characteristics as can be observed. Nevertheless, they all share a common trait – their color is a consequence of heating the photosphere to specific temperatures. In addition to those mentioned, these celestial bodies encompass Epsilon Shield and Beta Raven (bright giants), Delta of the Southern Triangle and Beta Giraffe (supergiants), Capella and Windemiatrix (giants), and numerous other cosmic entities. It is important to note that the color specified in the object’s classification does not always align with its visible color. This discrepancy arises due to the distortion of the true light shade caused by gas, dust, and atmospheric conditions. Astrophysicists employ a spectrograph device to determine the color accurately, surpassing the capabilities of the human eye. Thanks to this instrument, scientists can discern blue, yellow, and red stars situated at vast distances from us.
Stars are actually suns. This groundbreaking discovery was made by an Italian scientist who goes by the legendary name of Giordano Bruno. His name is renowned worldwide for his contributions to the field of astronomy. Bruno’s research revealed that among the vast expanse of stars, there are many that resemble our own Sun in terms of size, temperature, and even color, which is intricately linked to temperature. However, there are also stars that deviate from the norm, such as giants and supergiants.
Ranking System
In order to bring some organization to the vast array of stars in the sky, astronomers have devised a ranking system to classify them. This system categorizes stars based on their respective luminosity classes. For instance, stars that emit light thousands of times brighter than the Sun are classified as giants. On the other hand, stars with minimal luminosity are referred to as dwarfs. Scientists have determined that the Sun falls into the category of an average star based on this classification.
At one point, astronomers held the belief that stars emit light differently due to their varying positions in relation to Earth. However, it has been discovered that this is not entirely accurate. Astronomers have determined that stars of the same distance from Earth can exhibit vastly different levels of brightness. This brightness is not solely determined by distance, but also by the temperature of the individual stars. To compare stars based on their apparent brightness, scientists utilize a specific unit of measurement known as absolute stellar magnitude. This measurement allows for the calculation of a star’s true emission. Through this method, scientists have deduced that there are only 20 stars in the sky that possess the highest level of brightness.
What causes stars to have different colors?
In the previous discussion, astronomers categorized stars based on their size and luminosity. However, this is not the complete classification system. Apart from size and apparent luminosity, stars are also classified according to their color. This is because the light emitted by each star consists of waves with specific wavelengths. These wavelengths are relatively short. Despite their shortness, even slight variations in the size of these light waves can significantly alter the color of a star. The color of a star is directly influenced by the temperature of its surface. For instance, if you heat an iron frying pan on a stove, it will also change color accordingly.
The color spectrum of a star serves as a unique identifier, distinguishing its most defining characteristics. For instance, astronomers have classified both the Sun and Capella, a star similar to the Sun, into the same category. These stars exhibit a pale yellow hue and possess a surface temperature of 6000oC. Additionally, their spectra share common elements, such as magnesium, sodium, and iron.
Stars like Betelgeuse and Antares, on the other hand, display a distinct red coloration. With a surface temperature of 3000oC, these stars emit titanium oxide. Sirius and Vega, on the contrary, emit a brilliant white light. Boasting a surface temperature of 10000oC, these stars’ spectra feature prominent hydrogen lines. Lastly, there’s Orion, a bluish-white star with a scorching surface temperature of 30000oC.
The classification of stars in astronomy is determined based on the color of their outer shell in the optical range. This crucial data is obtained through the analysis of the light reflected by the outer shell in the visible spectrum. The heat of light emitted by stars is explained by William Thomson, Stefan-Boltzmann’s law, Wien’s law, and Max Planck’s theory (see Light Radiation – Light#Heat of Light).
Thus, it is understood in the realm of radiation physics that the temperature of a completely black object can be deduced by measuring the wavelength of reflected light radiation. Consequently, a completely black object with a reflected light temperature of 3 K will exhibit a peak in the visible spectrum at a frequency of 3-10 11 Hz. Similarly, when observed from a completely black object with a luminosity temperature of 6000 K, the Sun will display a peak in the visible spectrum within the yellow color range.
Color of stars and its wavelength [ edit ]
According to the curriculum, it is widely understood that:
A star is an extremely hot mass of gas.
Furthermore, based on astronomical research and observation, it is commonly acknowledged that:
Stars possess unique colors and varying intensities within the visible light spectrum. By analyzing the color of a star, scientists are able to determine a multitude of parameters and ongoing processes occurring within the star.
Color, including the color of stars, is determined by the abundance of photons of that particular color. Each color in the visible light spectrum has its own unique wavelength, which is determined by the physics of radiation. We owe our understanding of these concepts to Isaac Newton, who established the foundations of classical physics. Newton’s followers further delved into the mysteries of light radiation, giving rise to the field of spectroscopy, as well as nuclear and quantum physics, and quantum mechanics, which shed light on every aspect of this fascinating physical phenomenon. Without this scientific groundwork, which is even covered in the standard school curriculum, it would be impossible to comprehend why stars emit specific colors, the processes occurring within stars of different colors, and the characteristics of stars based on their color. With a deeper understanding of these scientific principles, we gain insight into the secrets of the universe, ranging from the birth and death of stars to the intricacies of existing star systems and galaxies.
Thus, scientists have a comprehension of stars as celestial matter that is heated by fusion energy and held together by gravitational and magnetic forces. Radiation in all regions of the spectrum provides the primary information about stars. The properties of a star are determined by its mass, chemical composition, and age. As stars emit energy into space, they undergo changes over time, resulting in alterations to their mass and chemical composition.
A wide range of colors can be observed in the visible optical radiation, as indicated in the following table:
Range of Wavelength, Å
During nucleosynthesis, each element emits light at a specific maximum temperature, which can be determined from the table below:
Element that emits light radiation during nucleosynthesis
Luminosity temperature, K
Ionized calcium, neutral metals
Metals that are neither positive nor negative in charge,
have the ability to absorb specific wavelengths of light,
forming distinct bands of absorption.
These absorption bands can also be observed in molecules called cyanine (CN)2.
For instance, by studying the light emitted by the Sun, we can determine the temperature and luminosity of ionized calcium during the process of nucleosynthesis. The light radiation from the Sun provides valuable information about the inner workings of the star, including the synthesis of various elements. Potassium synthesis, in particular, can be inferred from the presence of electrons in the solar corona, where photons are emitted as a result. It is through this process of radiation in the solar corona that the presence of helium was discovered by analyzing the emitted spectrum.
Based on the criteria of maximum luminosity during nucleosynthesis inside stars, a spectral class scale was established.
However, before delving into the subject, it is worth exploring the fascinating background of star classification, which was initially pioneered by the renowned astronomer Angelo Secchi.
The Groundbreaking Star Classification System by Angelo Secchi [edit].
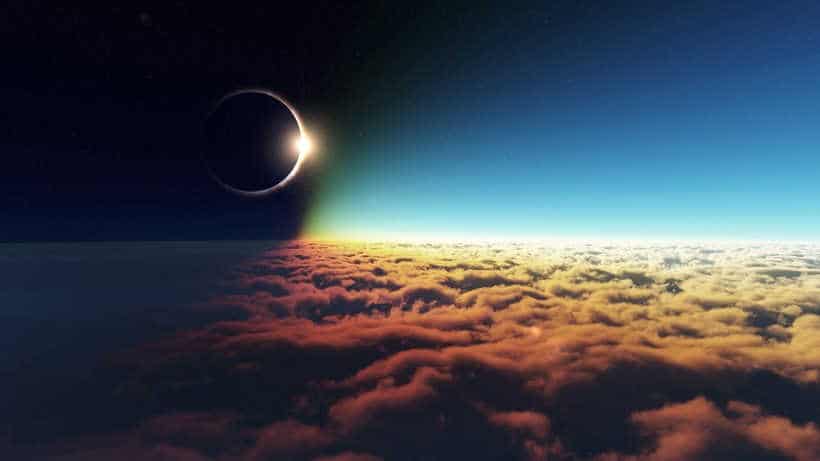
Angelo Secchi dedicated numerous years to studying the surface of the Sun, meticulously examining its spots, granules, prominences, and other intriguing phenomena. Through his extensive research, he formulated a compelling theory about the Sun’s structure, proposing that it consists of a highly compressed gas. Secchi even demonstrated that the prominences observed during a total solar eclipse are actually part of the Sun itself. Furthermore, he made significant discoveries regarding the behavior of prominences and identified smaller gas emissions known as spicules, shedding further light on the nature of the Sun. Secchi’s groundbreaking work on the Sun, titled “The Sun,” garnered widespread recognition and acclaim. Additionally, in 1860, Secchi achieved another milestone by capturing the first-ever photograph of the solar corona.
In accordance with Angelo Secchi’s classification, stars are categorized into different classes:
- Class I – includes white and blue stars that have wide hydrogen absorption lines in their spectrum.
- Class I, subtype – refers to Class I stars that exhibit narrow lines in their spectrum instead of broad bands.
- Class II – consists of yellow and orange stars that display weak hydrogen lines, but with distinct metal lines.
- Class III – comprises orange and red stars in which the lines form bands that darken towards the blue end of the spectrum.
- Class IV – denotes red stars that possess strong bands and carbon lines.
- Class V – represents stars with emission lines.
Despite the presence of comparable works in the domain of stellar spectroscopy, Secchi’s classification continued to be widely accepted until the introduction of the more comprehensive Harvard classification in the early 20th century, which was based on photographic spectrograms.
Based on Angelo Secchi’s system of star classification, the Sun falls into the second category. However, classifying the Sun without a thorough examination would be inadequate.
Hertzsprung-Russell stellar classification diagram [ edit ]
The diagram that represents the classification of stars based on their luminosity and temperature is known as the Hertzsprung-Russell stellar classification diagram. This diagram is a valuable tool used by astronomers to understand the evolution and characteristics of different types of stars. It is named after Danish astronomer Ejnar Hertzsprung and American astronomer Henry Norris Russell, who independently developed the concept in the early 20th century. The diagram plots the temperature of stars on the horizontal axis and their luminosity on the vertical axis. By studying the positions of stars on the diagram, astronomers can determine their stage of evolution, size, and other important properties. The Hertzsprung-Russell diagram has greatly contributed to our understanding of stellar evolution and continues to be a fundamental tool in modern astrophysics.
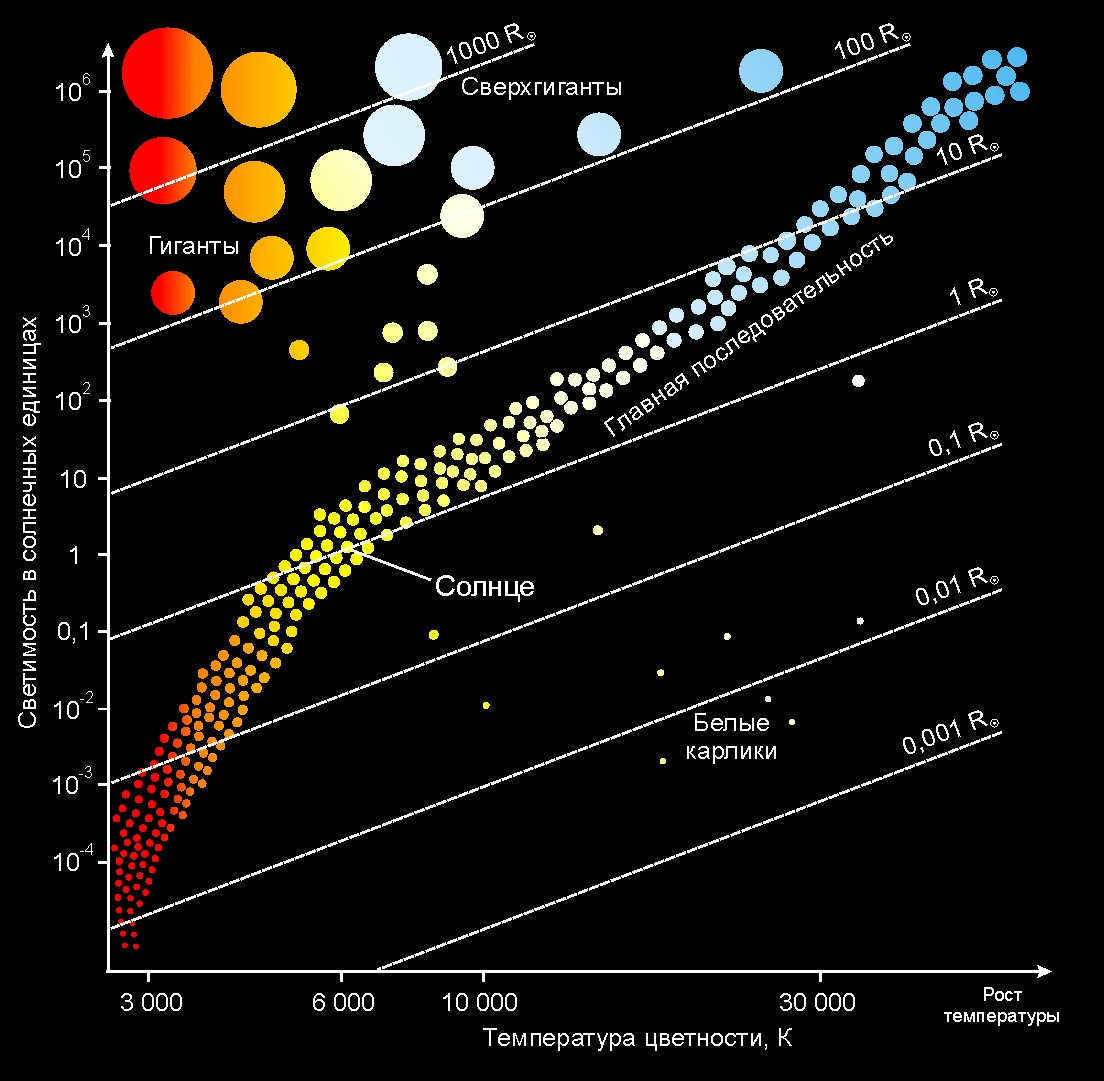
In 1913, Einar Hertzsprung, a Danish astronomer, and Henry Norris Ressel, an American astronomer, each independently conceived the idea of creating a theoretical diagram that would connect two fundamental stellar parameters: temperature and magnitude. The outcome was a diagram that became known as the “Hertzsprung-Ressel diagram” in honor of the two astronomers. The Hertzsprung-Ressel diagram is instrumental in comprehending the life cycle of stars and is widely utilized in standard classification practices, complementing the classification system developed by Angelo Secchi.
The diagram represents the Sun with a luminosity of -1. Since the Sun has a color temperature of 5800 degrees, it is positioned in the middle of the diagram. Stars with a higher luminosity than the Sun are placed above on the diagram, while stars with a lower luminosity are located below. Similarly, stars with a higher color temperature than the Sun are arranged in ascending order, and those with a lower color temperature are arranged in descending order. The size of the stars, as measured by solar radii, is also taken into account in the Hertzsprung-Russell diagram. The Sun, being in the main sequence, is marked with a size of -1.
The Hertzsprung-Russell diagram categorizes stars into the following sequences:
- Ia, Ib – sequence of faint supergiants,
- III – a series of dim giants,
- IV – a series of subgiants,
- V is known as the main sequence,
- VI – a series of subdwarfs,
- VII – the series of white dwarfs.
When astronomers classify the Sun according to Angelo Secchi’s classification and the Hertzsprung-Russell diagram, they classify it as a spectral class 2V star. However, this classification alone is not complete without the Harvard classification of stars.
Spectral classes of stars [ edit ]
In the early 1900s, the Harvard Observatory conducted a significant project that resulted in the renowned HD catalog, also known as the Henry Draper catalog. This catalog contains a classification of the spectra of hundreds of thousands of stars. Annie Cannon, a dedicated scientist, made a remarkable contribution to this project by manually classifying the spectra of nearly 400,000 stars. During the catalog’s development, a system of classifying stellar spectra was established, which is still widely accepted today with only minor modifications. The catalog remains an important source of information about star spectra to this day.
The astronomers at Harvard made the decision to label the spectral classes of stars using the letters of the Latin alphabet from A to Q. They largely followed Angelo Secchi’s classification system, which organized the spectra from simple to complex, but expanded upon it in greater detail. Secchi’s Type I corresponded to Harvard grades of A, B, C, and D. Type II encompassed grades from E to L. Type III was represented by class M, and type IV was class N. Additionally, the astronomers at Harvard assigned all spectra with emission lines to class O, and the spectra of planetary nebulae to class P. The final class, Q, was used for the ambiguous spectra of stars.
The current version of the Harvard classification arranges the primary spectral classes of stars in the following order:
Based on this categorization, stars belonging to the O class are characterized as blue, while those in the B class have a bluish hue. Stars in the A class are described as white, while those in the F class have a yellowish appearance. Stars of the G class are yellow, while those in the K class are orange. Stars classified as M are known for their red color.
Additional categories can be found among stars with different spectra – W, P, and Q. The classification of stars represented by the letter W (sometimes WR) includes stars with color temperatures up to 100,000 K and strong emission lines in their spectra, indicating the release of gas from their atmospheres. In more detailed descriptions, an additional letter is added to indicate the chemical element: in type WN spectra, nitrogen ion bands are observed, but not carbon bands; in type WC spectra, nitrogen bands are absent, but there are multiple ionized carbon and oxygen bands. Class P includes the emission spectra of planetary nebulae, which can be considered as highly rarefied “flying away” shells of old stars, and the bright cores of planetary nebulae (i.e., the remnants of stars) have color temperatures up to 200,000 K, which is why they are placed to the left of the hottest normal stars. The letter Q is used to denote the spectra observed during the outbursts of new stars. The letter Y is used to designate the coolest stars, brown dwarfs.
Q – P – W (N, R, C) – O – B – A – F – G (C) – K (S) – M – L – T – Y
On the Harvard scheme, there has been an addition on the right side. This resulted in the introduction of new spectral classes L and T, which appear to extend the main sequence (V luminosity class) towards the coolest stars. Stars in the L and T classes are known as brown dwarfs and have temperatures below 2000 K. Similar to classes M, C, and S, their spectra also exhibit a wide range of molecular bands.
Furthermore, the Sun is classified as a G2V star according to the general classification of stars.
Characteristics and features of different types of stars
Astronomers from the Mount Wilson Observatory have introduced additional designations to further classify stars. For main sequence stars on the Hertzsprung-Russell diagram, the symbol d is used, derived from the word “dwarf.” Giants are designated with the symbol g, while subdwarfs and subgiants are designated with sd and sg respectively. White dwarfs are designated with wd. This classification system provides a more detailed understanding of stars, classifying them based on both temperature (spectral class) and luminosity (luminosity class).
Stars with sharp and narrow spectral lines were designated as c. Instead of the Harvard designations for the subclasses of the spectral class M, the subclasses of the spectral class M were designated as M0 – M6. Therefore, for example, a red giant of class K5 would be designated as gK5, and a subdwarf of class G0 would be designated as sdG0. Additionally, an additive index was used to designate stars with sharp lines in this spectral subclass as s, and for spectra with broad lines, the index used was n. Stars with the index n are typically fast rotators, and the fastest rotators may even have the designations nn.
Unlike the initial studies on the application of spectral analysis in astronomy (Fraunhofer’s works), the designations for certain prominent spectral lines have been retained to this day. For instance, the spectral lines of singly ionized calcium CaII with wavelengths 3970Å and 3934Å are denoted by symbols H and K. The lines for neutral sodium with wavelengths 5896Å and 5890Å are denoted by the symbols H and K, respectively, as D2 and D1.
Additionally, astronomers from the Mount Wilson Observatory, Harvard Observatory, and Yerkes Observatory have developed additive indices and placed them after the star’s spectrum:
- c – deep narrow lines
- comp – composite spectrum
- con – no visible absorption lines
- e – emission (hydrogen emission in O stars)
- em – emission detected in metal lines
- ep – peculiar emission (lines with a different characteristic from the normal class)
- er – explicitly reversed emission lines
- eq – emission with absorption at shorter wavelengths
- ev – Variability only applies to emission lines
- ew – emission typically found in stars of class W
- f, (f), ((f)) – helium and neon emissions observed in O stars
- h – WR-class stars with hydrogen emission lines
- ha – WR-class stars with both absorption and emission lines of hydrogen
- k – interstellar lines
- m – strong metal lines
- n – diffuse lines (broad and blurred) caused by fast rotation
- neb – additive spectrum of the nebula
- nn – lines that are very blurred and diffuse
- p – spectrum with peculiar irregularities
- pq – spectrum that resembles that of a new star
- s – lines that are sharp and narrow
- sh – spectrum with an envelope
- ss – lines that are very narrow
- v or var – changes in the spectrum not caused by orbital motion or pulsation
- w or wk or wl – faint lines
This classification system provides a comprehensive understanding of stars by categorizing them based on their spectral characteristics.